Trend and insight

April 3, 2026

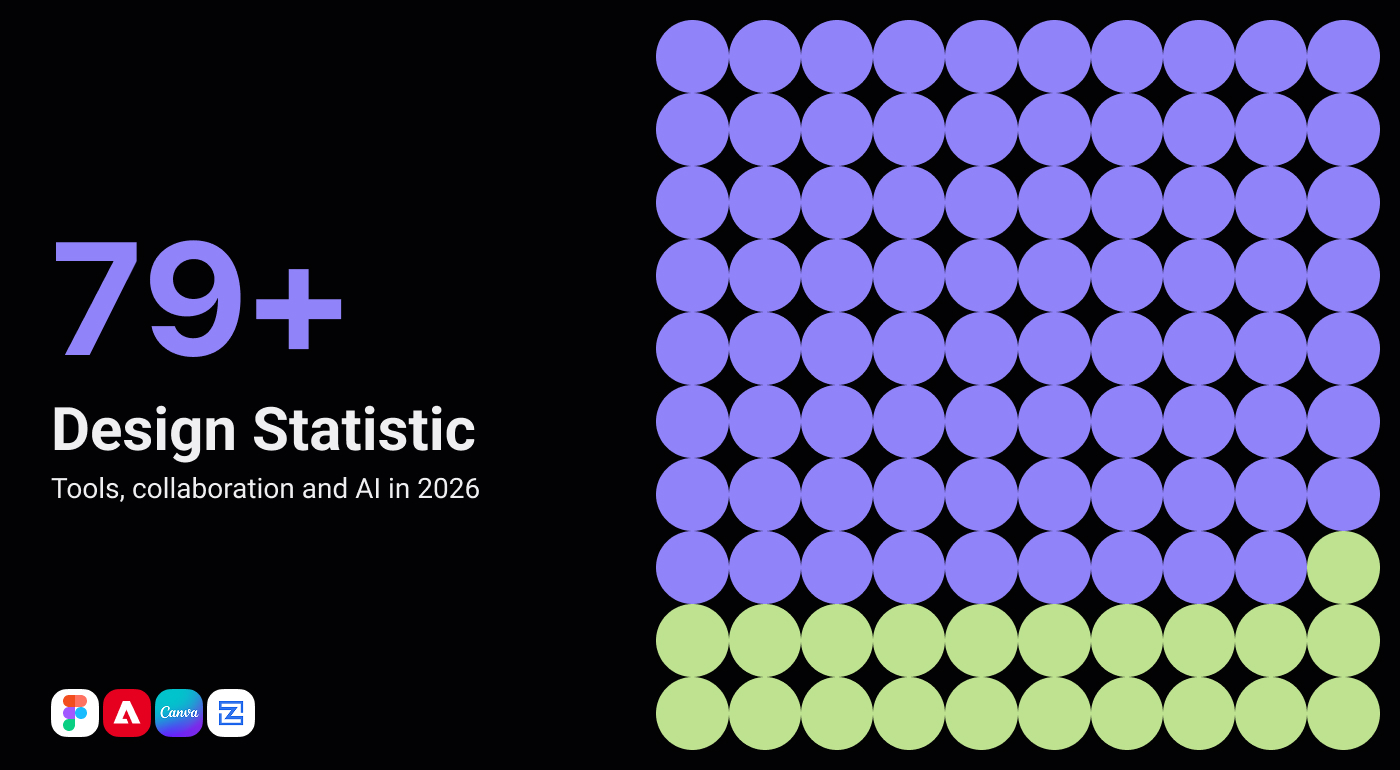
79+ design statistic

Tools, collaboration and AI in 2026

Share

Mail to

Eugene, UX/UI Designer
This article was created based on content from Figma.
Design decisions can be hard to explain, especially when the people you’re presenting to don’t speak the same visual language. While most teams agree that good design matters, stakeholders often want proof that it drives results.
That’s where data comes in. These design statistics help translate creative intuition into measurable impact, whether you’re justifying a choice, scoping a project, or building a case for investment.
Read on learn to learn:
Current benchmarks for design salaries and remote work trends
How AI is reshaping the creative landscape and designer skill sets
Insights into team collaboration and process efficiency
Key data on mobile responsiveness, page load expectations, and accessibility
How design directly influences brand trust and ROI

Design employment statistics

Recent data paints a picture of a design workforce that’s adaptable, resilient, and increasingly happier with how they work. These design statistics are a snapshot of how designers are feeling about their careers, their workspaces, and the future of the profession.
1. 41% of designers and developers say they were more satisfied with their job in 2024 than in 2023. (Figma, 2025)
2. Remote work is now the norm, with 97% of professionals working away from the office at least part time, and over half doing so fully. (Figma, 2025)
3. In Europe, 71% of designers and 75% of developers say they’re happy with their current workplace setup. (Figma, 2025)
4. Across the Asia-Pacific region, 70% of designers report being satisfied with their working arrangements. (Figma, 2025)
5. In the U.S., 62% of designers and 77% of developers express happiness with how and where they work. (Figma, 2025)
6. 45% of designers believe the job market has declined in recent years. (Figma, 2025)
7. The global value of the graphic design market is projected to pass $56 billion by the end of 2025. (NMSC, 2025)
8. Employment in graphic design is expected to remain stable, with a projected 2% growth rate through 2034. (U.S. Bureau of Labor Statistics, 2025)
9. The median annual pay for graphic designers in 2024 was $61,300, or $29.47 per hour. (U.S. Bureau of Labor Statistics, 2025)
10. The industry is pretty evenly split by sex: 50.2% of graphic designers in the U.S. are women, and 49.8% are men. (Zippia, 2025)
11. The average age of graphic designers in the U.S. is 38 years old. (Zippia, 2025)
12. 68% of graphic designers in the U.S. hold a bachelor’s degree. (Zippia, 2025)
13. 92% of business leaders expect employees in non-design roles to possess basic design skills and knowledge. (Canva, 2024)

AI in design statistics

Artificial intelligence (AI) has quickly integrated into the design workflow of teams everywhere. While questions around trust and quality remain, the data shows that designers are embracing these tools to automate repetitive tasks and accelerate exploration. Here’s a look at how AI is currently reshaping the design process.
1. Looking ahead, 85% of designers and developers say AI will be essential to their future success. (Figma, 2025)
2. Efficiency is the main driver, with 78% of professionals saying that AI tools significantly speed up their workflows. (Figma, 2025)
3. However, only 58% say it improves the quality of their work. (Figma, 2025)
4. In the discovery phase, 38% of designers and 43% of developers use AI for customer research. (Figma, 2025)
5. 40% of designers and 29% of developers use AI for data analysis. (Figma, 2025)
6. In the design phase, 33% of designers use AI to generate design assets, 22% use it to create first drafts of interfaces or websites, and 21% use it to explore different layouts or themes. (Figma, 2025)
7. 40% of designers and developers don’t yet trust AI-generated outputs enough to rely on them fully. (Figma, 2025)
8. Strategic impact is still in question, as only 27% believe AI will significantly move the needle on company goals in the next year. (Figma, 2025)
9. More than half (56%) say AI makes them feel more hopeful about where design is headed. (Figma, 2025)
10. 86% of global creators report that they now use generative AI in their work. (Adobe, 2025)
11. 81% of creators say AI helps them produce content formats or styles they could not have created on their own. (Adobe, 2025)
12. 70% of creators express excitement about the potential of using AI agents that can execute tasks autonomously. (Adobe, 2025)
13. 85% of marketers and creatives report saving roughly four hours per week thanks to GenAI tools. (Canva, 2025)
14. 77% of marketing and creative leaders agree that GenAI tools actively enhance their team's creative output. (Canva, 2025)
15. 63% of professionals believe experimenting with AI has improved their ability to communicate visually, regardless of their job title. (Canva, 2025)
16. In just 10 years, the generative AI design sector is forecast to grow 18x its current size, from $741 million to $13.9 billion. (Precedence Research, 2024)
17. 35% of creative agencies say they use AI for design and branding purposes. (Function Point, 2025)

Design workflow statistics

Great design requires constant collaboration between designers, developers, and stakeholders. Collaborative tools have improved the process, but teams still face hurdles ranging from administrative busywork to the complex handoff between design and code. Here’s a look at how modern teams work together.
1. 84% of designers say they collaborate with developers at least weekly. (Figma, 2025)
2. 77% of designers with high work satisfaction use collaborative tools more often than those with lower satisfaction. (Figma, 2025)
3. 58% of satisfied designers use whiteboard tools more often than those with lower satisfaction. (Figma, 2025)
4. 91% of developers and 92% of designers believe the handoff process could be improved. (Figma, 2025)
5. 57% of creative teams spend more than a quarter of their total work time on non-creative tasks like file management and compliance. (Monotype, 2025)
6. Font version control is a major friction point, with 42% of creative professionals citing it as a specific challenge in their daily workflows. (Monotype, 2025)
7. Licensing complexity is also a challenge, with 68% of organizations facing hidden compliance risks related to their font usage. (Monotype, 2025)
8. 31% of creative agencies cite scope changes as their single biggest barrier to productivity this year. (Function Point, 2025)
9. ‍91% of designers think designers and developers are at least sometimes “too different” to work together well. (CollabSoft, 2025)
10. 81% of designers feel developers value their work. (CollabSoft, 2025)
11. 57% of designers think developers are very open to feedback from designers. (CollabSoft, 2025)
12. 39% of designers say the best way to improve collaboration is for designers and developers to learn each other’s skills. (CollabSoft, 2025)
13. 28% believe that involving developers earlier in the design process would be the best solution, while 20% think that scheduling more meetings is the answer. (CollabSoft, 2025)
14. Only 13% believe that bridging the gap between tools would help. (CollabSoft, 2025)
15. 40% believe that better collaboration would lead to higher-quality products. (CollabSoft, 2025)

Web design statistics

Web design has evolved from strictly visual aesthetics to creating accessible experiences. As user expectations rise, the gap between a functioning site and a high-performing one often comes down to the details. The following statistics explore the current standards for accessibility, speed, and design complexity.
1. As of November 2025, there are 1.37 billion websites online, though only a fraction of these are actively maintained. (Netcraft, 2025)
2. 95% of companies agree that a professionally designed UX is critical to the success of startup mobile apps. (Goodfirms, 2025)
3. 80.3% of businesses rate usability as the single most important Web design factor, ranking it above visual aesthetics. (Goodfirms, 2025)
4. 90% of the lowest-performing e-commerce websites contain significant UX issues, compared to only 10% of top performers. (Reboot Online, 2025)
5. User frustration is rampant, with 39.6% of all digital sessions now containing “frustration signals,” like rage clicks or dead clicks, due to poor interface design. (Contentsquare, 2024)
6. 94.8% of the world's top 1 million home pages still fail to meet basic WCAG 2 accessibility standards. (WebAIM, 2025)
7. 79.1% of home pages contain low-contrast text, making it the most common design failure on the Web today. (WebAIM, 2025)
8. The average home page displays 58.6 images. (WebAIM, 2025)
9. 34.2% of home pages have missing form input labels, making navigation impossible for users relying on screen readers. (WebAIM, 2025)
10. As of November 2025, 51.7% of website traffic comes from mobile devices. (Statcounter, 2025)
11. The average scroll depth on mobile is only 45% of the page, meaning content placed below the fold is missed more often than on desktop. (Contentsquare, 2024)
12. The average online shopping cart abandonment rate has reached 70.22%. (Baymard Institute, 2025)
13. The average U.S. checkout flow currently contains 23.48 form elements, nearly double the ideal benchmark. (Baymard Institute, 2025)
14. JavaScript has surpassed images as the most requested file type on desktop pages, with 24 scripts vs. 18 images. (HTTP Archive, 2024)
15. The average desktop Web page now requires 71 separate requests to load, increasing the likelihood of layout shifts and visual stuttering. (HTTP Archive, 2024)
16. 70.5% of e-commerce sites are currently rated as “needs improvement” on Google Lighthouse performance tests. (Reboot Online, 2025)
17. 92% of top-ranking pages on Google load in less than three seconds. (Marketing LTB, 2025)
18. 84% of marketers report that adding video to their website has directly increased average dwell time. (Wyzowl, 2025)
19. Despite consistently testing poorly in usability studies, 42% of business home pages still use image carousels or slideshows in their hero section. (Orbit Media, 2024)
20. 93% of websites place their logo in the top left corner, making it the undeniable standard for brand anchoring and home navigation. (Orbit Media, 2024)
21. 13% of websites place social media icons in the header, a significant decrease compared to five years ago. (Orbit Media, 2024)
22. 90% of websites feature a standard horizontal navigation bar in the header. (Orbit Media, 2024)

ROI of design statistics

Design is a measurable business asset. A strong design practice drives efficiency, builds trust, and directly impacts the bottom line. The following statistics highlight the operational and financial impact of a design-forward mindset.
1. 77% of global business leaders report that communicating visually has directly increased their business performance. (Canva, 2024)
2. 90% of sales leaders say that using high-quality visual assets in their collateral has accelerated their sales cycles. (Canva, 2024)
3. Design also impacts the hiring pipeline, with 89% of HR leaders reporting that visual communication tools have shortened their hiring cycles. (Canva, 2024)
4. Organizations that invest in human insight platforms achieve a 415% return on investment over three years, with the initial investment paying for itself in less than six months. (UserTesting, 2025)
5. Improving product usability through early design testing increases customer retention by 10%. (UserTesting, 2025)
6. Validating designs before development allows teams to reduce iteration cycles by 25%, effectively avoiding millions in wasted developer rework costs. (UserTesting, 2025)
7. For large enterprises, connecting creative teams with optimized tools and governance can yield up to a 9x ROI over three years. (Adobe, 2025)
8. 75% of organizations report that their digital accessibility efforts have directly improved revenue. (Level Access, 2025)
9. 68% of organizations plan to maintain or increase their budget for digital accessibility in the coming year. (Level Access, 2025)
10. Despite the clear benefits, only 27% of organizations begin addressing accessibility during the design phase, with most waiting until development or later. (Level Access, 2025)
11. Design teams are being asked to do more with less, as marketing budgets dropped to 7.7% of overall company revenue in 2024. (Gartner, 2024)
12. 64% of CMOs report they lack the budget to execute their strategies fully, increasing the pressure on design efficiency and automation. (Gartner, 2024)
13. Without centralized design resources, 58% of non-creative employees spend up to 29 hours a week creating their own visual content, representing a massive hidden operational cost. (Adobe, 2025)

And a few FAQs

Which UX metrics most directly affect conversion rates?
It typically comes down to page load speed and task success rate. Keeping your site snappy and the path to purchase intuitive ensures users stay engaged and achieve their goals rather than bounce.
Is website accessibility really a legal risk for business?
Yes, failing to meet accessibility standards can lead to legal issues, but the implications go beyond compliance. Building inclusively ensures you aren't alienating the millions of users who rely on assistive tools, making your product stronger and more welcoming for everyone.
How much does color choice impact sales?
Color choice is a decisive factor. According to a 2025 Adobe survey, half of customers admit they’ve chosen a brand based primarily on color. A consistent color palette boosts brand recognition and helps build the trust necessary to close a sale.

Prepare for the next era of design

Ultimately, these design statistics act as a roadmap for where the industry is heading. Efficient workflows, AI integration, and clearly measurable ROI are becoming increasingly important. Design is no longer just about output — it has become a core asset that drives business performance.
To better understand this shift and make more informed decisions, it’s important to consistently reference high-quality sources. Here are some of the most widely used resources:
1. Nielsen Norman Group
Trusted sources like “UX improves conversion” and “usability impact”
Often considered the gold standard in UX research. It offers extensive data on UX ROI, usability, and user behavior, with a strong balance of qualitative and quantitative insights — making it ideal for portfolio references.
2. Adobe
Strong in areas like design maturity and creative ROI from a business perspective
A primary source for design ROI statistics, widely cited across the industry.
3. UserTesting
Practical insights like cost savings from early testing
Focused on usability, testing, and validation ROI.
4. Level Access
Provides key data connecting accessibility with business outcomes
Useful for demonstrating how accessibility drives revenue.
5. Canva
Covers areas like sales, HR, and brand communication
Explores how visual communication impacts real-world performance.
By grounding your design decisions in these kinds of resources, you move beyond intuition and into evidence-based thinking. In your next project, don’t just rely on instinct — use data to make your case.